Counter:
Pumping
Plant Profit
On-Line Management
and
Control
Stanislav Pejovic PhD
in cooperation with
Electronic Design
1997
===============================
Troubles are repeating every day.
This Software helps you to prevent
them.
___________________________________
Address your letter to:
Stanislav Pejovic
E-mail: pejovics@asme.org
Back to <Home Page> click here.
Pumping Plant Profit On-Line Management and
Control
Some new
features:
- Maximum profit
increase through optimum selection of operating point
- Profit
increase of pumping plant
- Profit
increase of pumping hydraulic system.
- Recommended
number of units in operation in order to achieve the maximum performance -
cost factor
- Estimate time
intervals between scheduled maintenance and/or replacement of unit
components
- Direct
comparison of current on-line profit to reference profit characteristics
- Direct
comparison of current on-line production costs to reference production
costs characteristics
- Dynamic
analyses of bearing vibrations
- Energy losses
of severe transients
- Multiple
response spectra; multiple time history loads; multiple vibration analyses
- Improved
control and monitoring system
- Interactive
on-line and replay on-line and of-line analyses
- Recommendations whether
new sub units or plants should be built
- Severity of transients (
Abstract
We propose here a
Pumping Plant Profit On-Line Management and Control software of pumping
units custom designed to increase profit, to instruct plant and system
technical and management staff what to do when selecting the most profitable
operating points of the system. Selecting the most profitable plant operation
mode so that the system could have the highest efficiency.
We conclude here that by
selecting the best exposure rate the profitability and reliability of plants
and related subsystems can be increased. Optimizing the pumping system by
applying the PP Profit On-Line Management and Control softwares of all
critical plant units into the monitoring and control computer system one may
increase profitability and minimize energy consumption level.
Selection of input data is
based on Standards, Guidelines, Tests, and Technical Literature results. By
means of statistical analysis of measured and recorded data, the efficiency of
the PP Profit On-Line Management and Control software could be improved
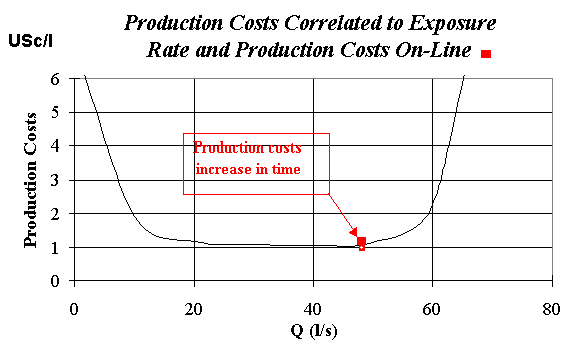
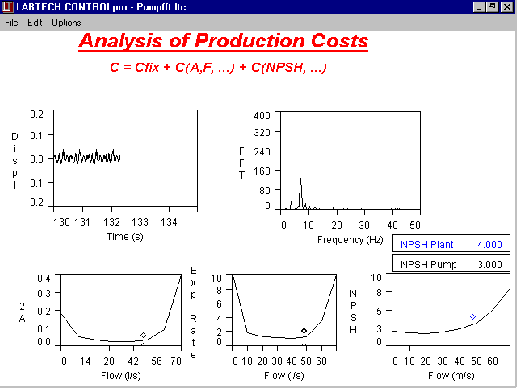
Production Costs
Energy production costs,
see Fig. 1, are dependent on vibration intensity and corespondent exposure rate
increasing continuously in time. They could be presented in a form dependent to
the exposure rate. According to literature and our experience the present chart
is constructed. The statistical data on particular unit should and could
improve and update application and software data.
Fig. 1. Reference production costs and on-line
production costs
Based on fixed production
costs cfw (Cent/l) and cost Cpw
dependent on exposure rate e, amplitudes A, corresponding
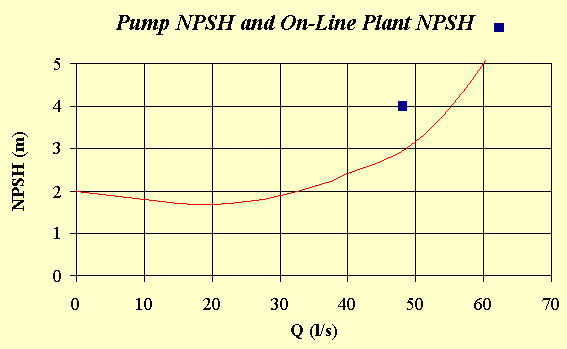
frequencies F, Net Positive Suction Head NPSH (cavitation), etc.
the profit p (USCents/l) is
Even if the initial cost of
a plant is high the balance could be achieved by adequate low maintenance and
replacement costs reducing vibrations and exposure rates.
Profit
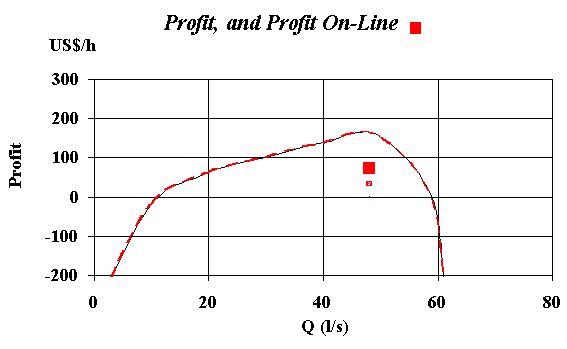
From the Chart, see Fig. 2,
evidently profit could be increased applying PP Profit On-Line Management
and Control analyses. The best operating zone is around 20 - 40 l/s. Over
load above 60 l/s reduces profit destroying units. Operating discharge smaller
than 10 l/s is also inconvenient.
Fig. 2. Reference profit and on-line profit
If a unit operates
frequently close to 65 l/s or even over, the system has not enough capacity and
new plants and additional units should be built. If a unit frequently operates
in zone between 0 to 10 l/s unnecessary large numbers of units of the system
are in operation.
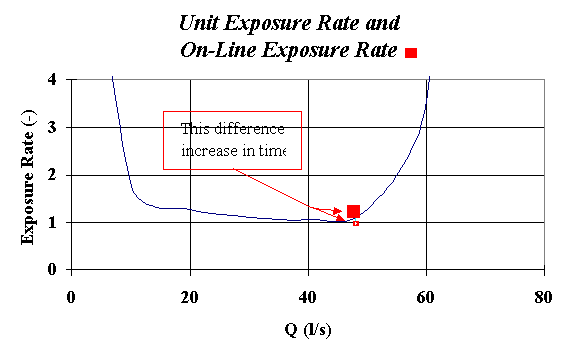
Exposure rate
Exposure rate, see Fig. 3,
as correlation between the real time and reference time of operation, is the
most important characteristic of a unit. It is a statistical data. Some
standards, guidelines and technical papers consider vibration of bearings, and
correlate them to the exposure rate. The on-line measured data compared to the
data measured several hundred hours ago are changing in time. They are highly
influenced by real time of operation and exposure rate, corespondent to the
operating point. The difference marked by (red) arrows generally increase in
time during unit operation. It is proportional to the times of operation and
corresponding exposure rates for the particular bearing. Vibrations (amplitudes
and corresponding frequencies), intensive cavitation, etc. has strong influence
on numerical values of exposure rate. The presented charts are based on the
data from technical literature and should be and could be improved for any
plant analyzing files of measured and logged statistical data which will
improve numerical on-line measured and calculated values.
Fig. 3. Reference exposure rate and on-line
exposure rate
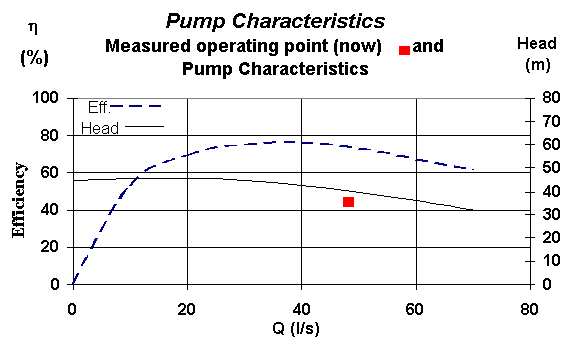
Pump Characteristics
If a plant
has an acquisition system for flow measurement the pump characteristic curves
could be compared to the site measurement and updated. Accuracy of test data
could be analyzed and the real machine curves improved.
Fig. 4. Pump characteristic curves
Fourier Analysis of Bearing Vibrations
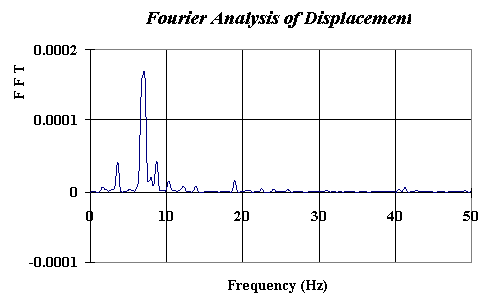
Fourier
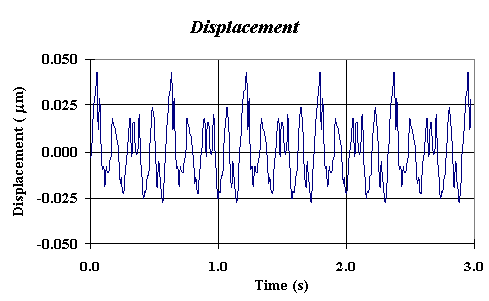
analyses, see Fig. 6, of measured bearing displacement, see Fig. 5, is
important input data for profit and reliability of plants.
Fig. 5. On-Line measured Displacement of guide
bearing
Fig. 6. On-Line or Off-Line Fourier analysis
Comment on
these data is very important. These charts for experienced staff could discover
very important information on plant and unit itself.
Measured Amplitude of Pump Bearing Vibrations
and Previously Measured Characteristics
Statistical
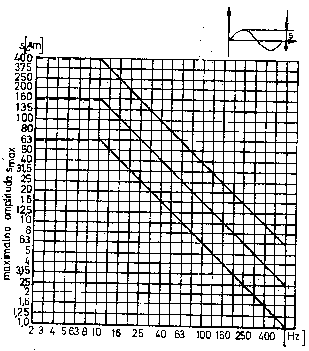
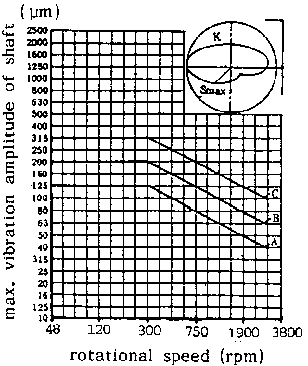
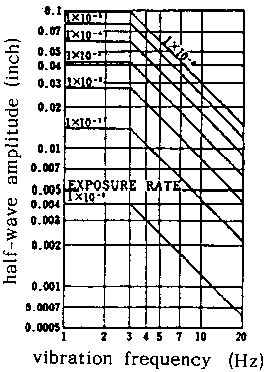
vibrating characteristics are based on guidelines and standards, see Figs. 7, 8
and 9. For the Plants with own experience these data could be sometimes more
realistic.
Fig. 7. Vibration standard VDI-2056
Fig. 8. Evaluation of shaft vibrations of
turbosets. VDI-2059, provided in 1979.
Fig. 9. Vibration amplitude of normal operation
and transient state Rund 1980.
Vibration
Characteristics of pumps are a typical one and could be easily measured on a
pump with PP Profit On-Line Management and Control measuring and
acquisition system.
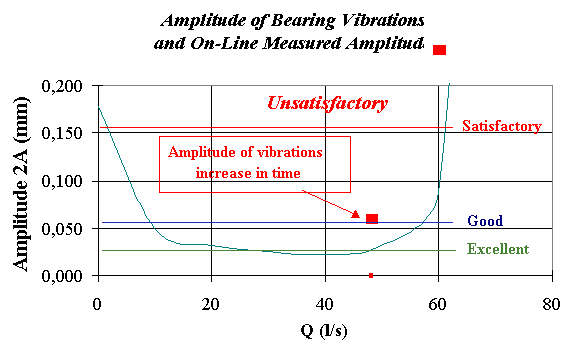
Amplitude
of bearing vibrations, see Fig. 10, increases in time. Distance of the measured
point from the previously measured amplitude characteristics are proportional
to the real time of operation and corresponding exposure rate. Applying this
method the time intervals of operation between maintenance and/or replacement
of unit components could be estimated. Statistical data, on particular unit and
plant, improves the results of analysis reducing operating, maintenance and
replacement direct cost.
Fig. 10. Reference amplitudes , and on-line
measured amplitude
Limit Values for Trip
Limit
values of amplitudes of displacement are stated in standards and guides. For
the presented case limits are: excellent 25 mic (microns), good 60 ,
satisfying 160 mic, and bad over 160 mic, see Fig. 10. When
limit good 60 mic is reached, an alarm should be given. The cause for
the increased vibrations should be analyzed. If limit satisfying 160 mic is
exceeded, damage must be expected. The unit is to be shut down for examination.
In the range satisfying, 60 - 160 mic, operation is only permitted under
particularly close supervision.
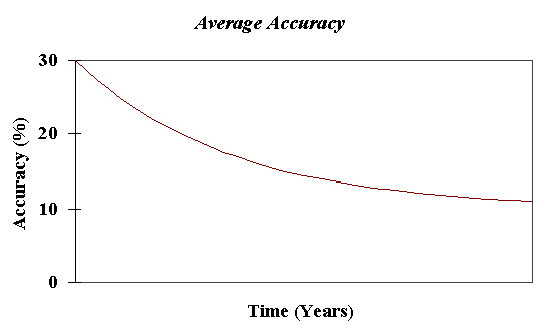
Accuracy
Starting PP
Profit On-Line Management and Control system by applying data from
standards, guidelines, tests and technical literature the average accuracy
could be about 30 % overall. Analyzing experimental measured and logged data
together with Pumping Plant technical and management experienced staff errors
can be reduced very quickly.
Average
accuracy, see Fig. 11, and individual accuracy of measured and calculated
values do not effect on profit since this method is a comparative one. If the PP
Profit On-Line Management and Control informations are correctly followed
the maximum benefit will be achieved and only the total value prediction will
be influenced by accuracy. That means that the predicted profit at the
beginning of a new time period will differ from the realized profit. Only this
difference could be reduced increasing accuracy
Fig. 11. Increasing of accuracy
Appendix
Flow
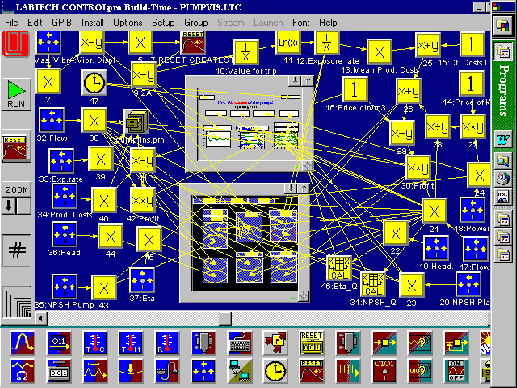
diagram, see Fig A1, as LABTECH CONTROL pro Build-Time shows advantages of data
acquisition and Process Control Software. Corresponding PP Profit On-Line
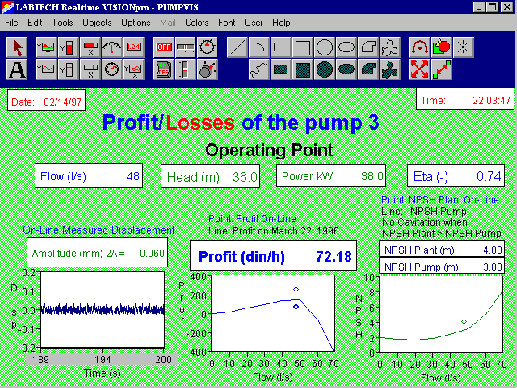
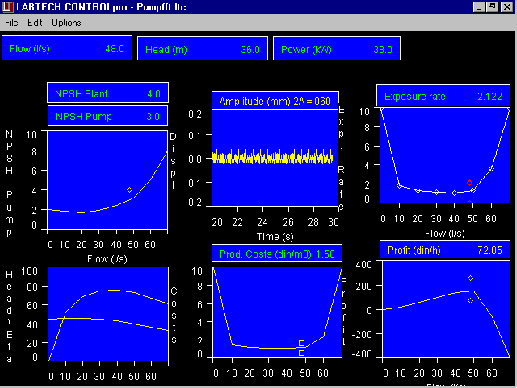
Management and Control VISION Widow, see Fig A2, gives information on
profit and losses of the unit in operation. Any measured on-line, laboratory
tests, and site test data could be put on the screen. Profit versus flow
characteristic and on-line measured data suggest the best operating point of
the unit. Following instructions PROFIT could be increased approaching the
maximum benefits.
With the
PP Profit On-Line Management and Control any or all charts and applications
could be on-line analyzed and logged in files and later on on-line or of-line
replied. Saved data could be very important in the case of incidents and
accidents. As a Black Box they could help investigators to discover what really
happened.
Fig. A1. Flow chart
Fig. A2. Screens of personal computer
===============================
Troubles are repeating every day.
This Software helps you to prevent
them.
____________________________________
Electronic Design has been founded in 1982 by Mr. Slobodan Kotri. In 1985, first in the
World, ED had developed the European Format industrial PC. Among World wide
customers are SIEMENS and PHILIPS, (World greatest producers of processing
systems). ED produces controllers based on PC platform. Mr. Kotri has been in
the field for more than 25 years. He has been always on the cutting edge of the
technology. He loves ice-cream and enjoys golf.
Troubles are repeating every day.
This Software helps you to prevent
them.
Stanislav Pejovic
E-mail: pejovics@asme.org
<All edited and
programmed by
Prof. S. Pejovic himself>
Back to <Home Page> click here.

